Back to: Spreadsheets – Excel
What are spreadsheets and how do they work?
A spreadsheet is a computer program that can capture, display and manipulate data arranged in rows and columns. Spreadsheets are among the most popular tools available for computer users.
A spreadsheet is generally designed to hold numerical data and short text strings. In a spreadsheet program, spaces that hold items of data are called spreadsheet cells. Cells can be renamed to reflect the data they hold and can be cross-referenced through row numbers and column letters.
A single spreadsheet can serve as a worksheet to compile data for a purpose. Multiple sheets can be combined to create a workbook.
Each column or row cell references a value and is labeled according to its placement — for example: A1, A2, A3. Data can be exported as a comma-separated values, or CSV, file and imported into other software or vice versa.
Rows and columns are common concepts in computer science and data analytics. These terms are also used in common parlance to describe the arrangements of everyday things.
The definition of a row is, “any set of objects or data that is aligned in a way that each one can be described as being to the left or right of another.”
In contrast to a row, columns organize items in a top-to-bottom fashion. In contrast to a row where items are to the left or right of another, all items in a column are described as either above or below another.
Commonly used spreadsheet features
The following are a few of the features available in most spreadsheet programs:
- Cell formatting. Within a spreadsheet, selected cells can be formatted to represent various numeric values. For example, financial data can be given accounting formatting, which will apply decimal places and commas to represent dollars and cents.
- Formulas. Under the formula bar, users can perform calculations on the contents of a cell against the contents of another cell. For example, if a person uses a spreadsheet to reconcile transactions, they could highlight all the cells that need to be added up and insert a sum function.
- Pivot tables. Using a pivot table, users can organize, group, total, average or sort data via the toolbar. The exact tools and functions vary depending on the application the user chooses.
Common spreadsheet applications
Daniel Bricklin and Bob Frankston created the first spreadsheet application in 1978, named VisiCalc for “visible calculator.” It was popular on the Apple II, one of the first computers used by businesses.
Lotus 1-2-3 surpassed VisiCalc to become the program that cemented the IBM PC as the preeminent PC in business during the 1980s and 1990s. IBM acquired Lotus in 1995 and continued selling Lotus 1-2-3 through 2013, when it discontinued the spreadsheet application, which had fallen behind Microsoft Excel in the 1990s and never recovered.
Examples of commonly used spreadsheet software programs include the following:
- Apache OpenOffice Calc is available for Linux, macOS, Windows, as well as other operating systems (OSes). The Apache Software Foundation developed Apache OpenOffice and first released the free, open source office productivity suite in 2012, but its roots go back to 2002.
- Google Sheets is part of Google’s web-based application suite, Google Workspace. Google Sheets is free and available as a desktop application for Google Chrome OS and mobile Oses, such as Android and iOS.
- LibreOffice Calc is a full-featured spreadsheet app released in 2011 as part of The Document Foundation’s free LibreOffice suite. LibreOffice and ApacheOpen office trace their roots to the same codebase, hence the same name for their spreadsheet applications.
- Microsoft Excel is part of the Microsoft Office suite and cloud-based subscription service Microsoft 365. Excel spreadsheets are available for Apple macOS and iOS, Google Android and Microsoft Windows OSes.
- Thinkfree Office was developed by Thinkfree Inc. as a free productivity suite with spreadsheet software specifically designed to provide a consistent experience across different devices. Each application in Thinkfree is compatible with the corresponding Microsoft Office application. An online spreadsheet version is available with cloud storage.
While Lotus 1-2-3 was the first to introduce cell names and macros, Microsoft Excel spreadsheets implemented a graphical user interface and the ability to point and click using a mouse.
What is Excel?

Excel is a spreadsheet program from Microsoft and a component of its Office product group for business applications. Microsoft Excel enables users to format, organize and calculate data in a spreadsheet.
By organizing data using software like Excel, data analysts and other users can make information easier to view as data is added or changed. Excel contains a large number of boxes called cells that are ordered in rows and columns. Data is placed in these cells.
Excel is a part of the Microsoft Office and Office 365 suites and is compatible with other applications in the Office suite. The spreadsheet software is available for Windows, macOS, Android and iOS platforms.
Excel uses a large collection of cells formatted to organize and manipulate data and solve mathematical functions. Users can arrange data in the spreadsheet using graphing tools, pivot tables and formulas. The spreadsheet application also has a macro programming language called Visual Basic for Applications.
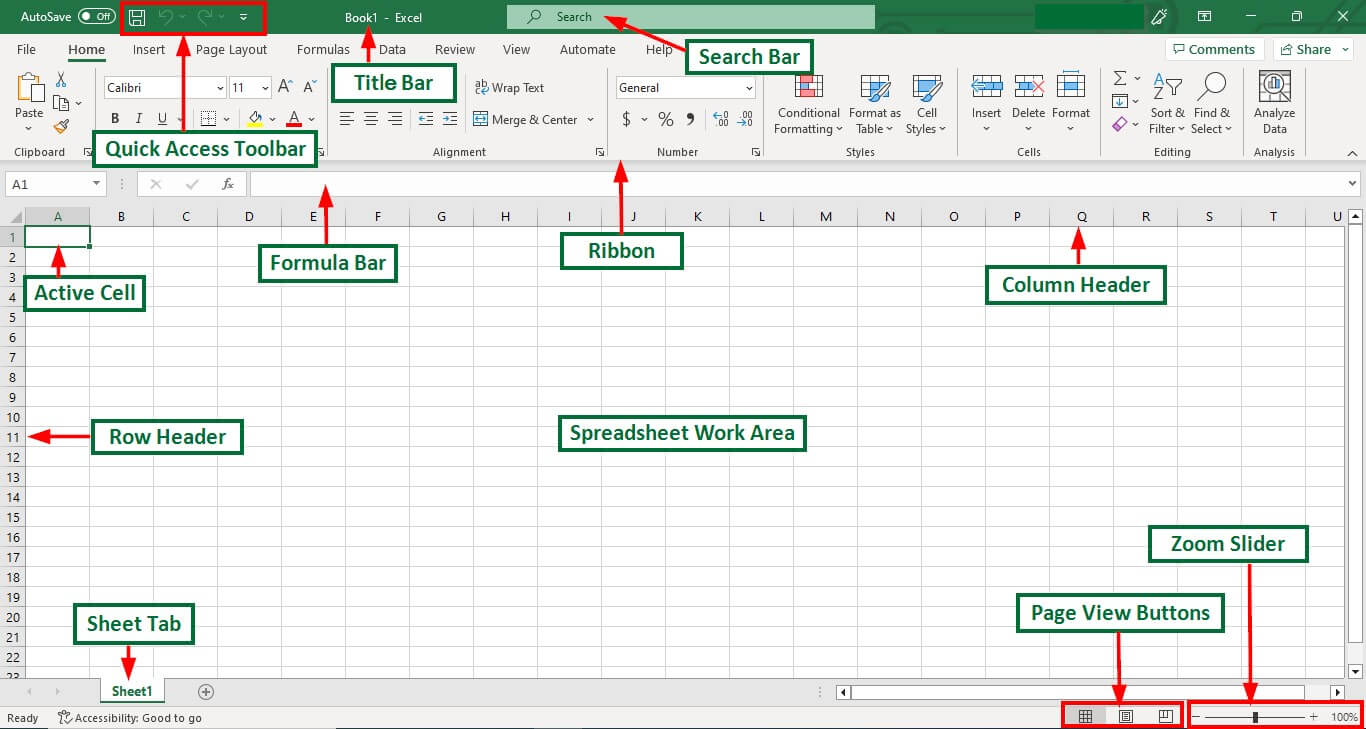
Excel terminology and components
Excel has its own terminology for its components, which new users may not immediately find understandable. Some of these terms and components include the following:
- Cell. A user enters data into a cell, which is the intersection of a column and row.
- Cell reference. This is the set of coordinates where a cell is located. Rows are horizontal and numbered whereas columns are vertical and assigned a letter.
- Active cell. This is the currently selected cell, outlined by a green box.
- Workbook. This is an Excel file that contains one or more worksheets.
- Worksheet. These are the different documents nested within a Workbook.
- Worksheet tab. These are the tabs at the bottom left of the spreadsheet.
- Column and row headings. These are the numbered and lettered cells located just outside of the columns and rows. Selecting a header highlights the entire row or column.
- Formula. Formulas are mathematical equations, cell references or functions that can be placed inside a cell to produce a value. Formulas must start with an equal “=” sign.
- Formula bar. This is the long input bar that is used to enter values or formulas in cells. It is located at the top of the worksheet, next to the “fx” label.
- Address bar. This bar located to the left of the formula bar shows the number and letter coordinates of an active cell.
- Filter. These are rules a user can employ to select what rows in a worksheet to display. This option is located on the top right of the home bar under “Sort & Filter.” An auto filter option can be selected to show rows that match specific values.
- AutoFill. This feature enables users to copy data to more than one cell automatically. With two or more cells in a series, a user can select both cells and drag the bottom right corner down to autofill the rest of the cells.
- AutoSum. This feature enables users to add multiple values. Users can select the cells they want to add and press the Alt and Equal keys. There is also a button to enable this feature on the top right of the home page, above “Fill” and to the left of “Sort & Filter.”
- PivotTable. This data summarization tool sorts and calculates data automatically. This is located under the insert tab on the far left.
- PivotChart. This chart acts as a visual aid to the PivotTable, providing graph representations of the data. It is located under the middle of the insert page, next to maps.
- Source data. This is the information that is used to create a PivotTable.